Let’s use the following code as example:
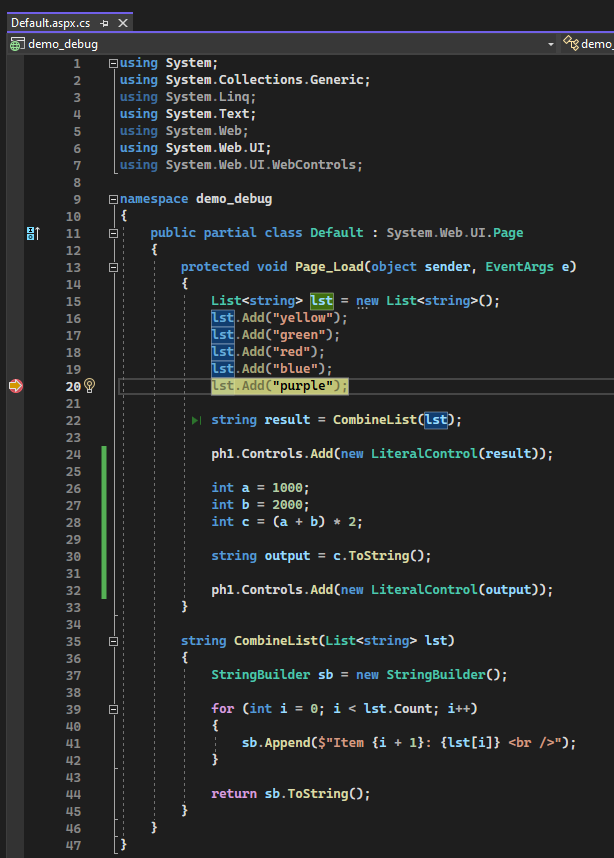
using System;
using System.Collections.Generic;
using System.Text;
using System.Web.UI;

namespace demo_debug
{
    public partial class Default : System.Web.UI.Page
    {
        protected void Page_Load(object sender, EventArgs e)
        {
            List<string> lst = new List<string>();
            lst.Add("yellow");
            lst.Add("green");
            lst.Add("red");
            lst.Add("blue");
            lst.Add("purple");

            string result = CombineList(lst);

            ph1.Controls.Add(new LiteralControl(result));

            int a = 1000;
            int b = 2000;
            int c = (a + b) * 2;

            string output = c.ToString();

            ph1.Controls.Add(new LiteralControl(output));
        }

        string CombineList(List<string> lst)
        {
            StringBuilder sb = new StringBuilder();

            for (int i = 0; i < lst.Count; i++)
            {
                sb.Append($"Item {i + 1}: {lst[i]} <br />");
            }

            return sb.ToString();
        }
    }
}
Break Points
Break Points are used to tell the compiler (in this case, refers to Visual Studio) to stop execution at specific point, so that we can perform some inspections of variables and their changes surrounding that area.
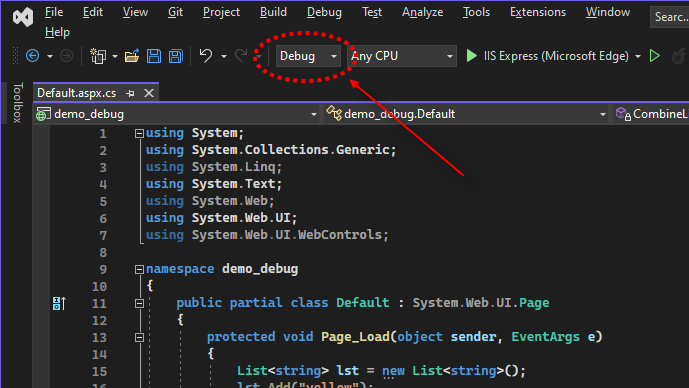
Before we start, the project needs to be set to “Debug Mode” for the break points to take effect.
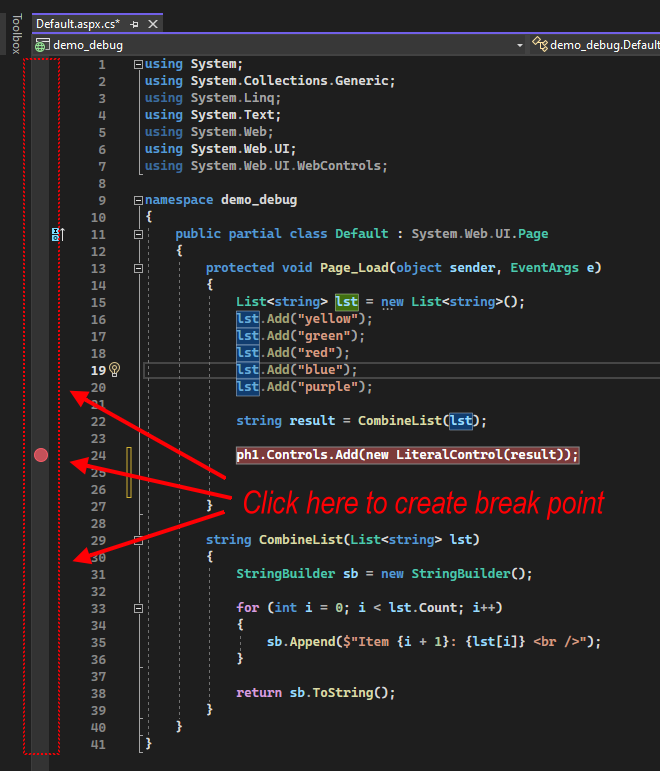
There are 2 ways to set a break point.
- 1st, by clicking on the “break point” bar
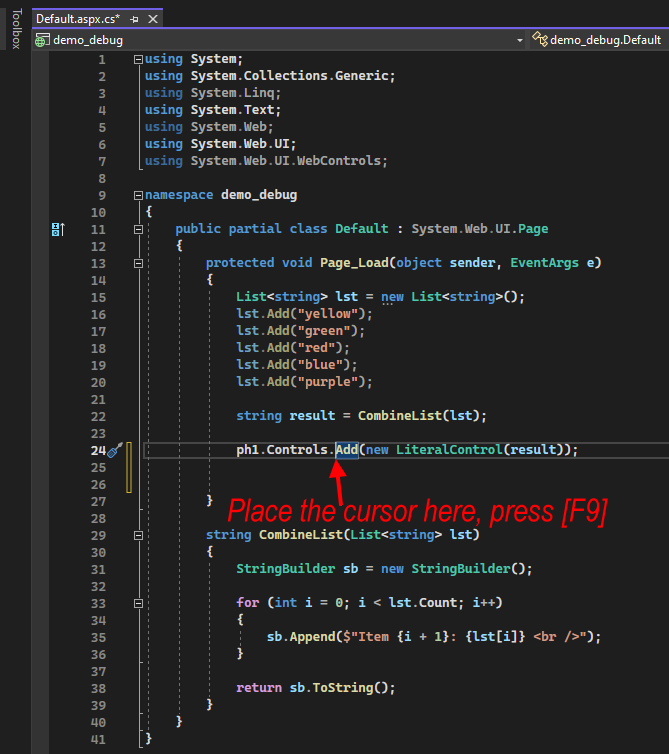
- 2nd, by pressing [F9] on the line.
1st Way, Click On “Break Point” Bar
2nd Way, Press [F9] On The Line of Code
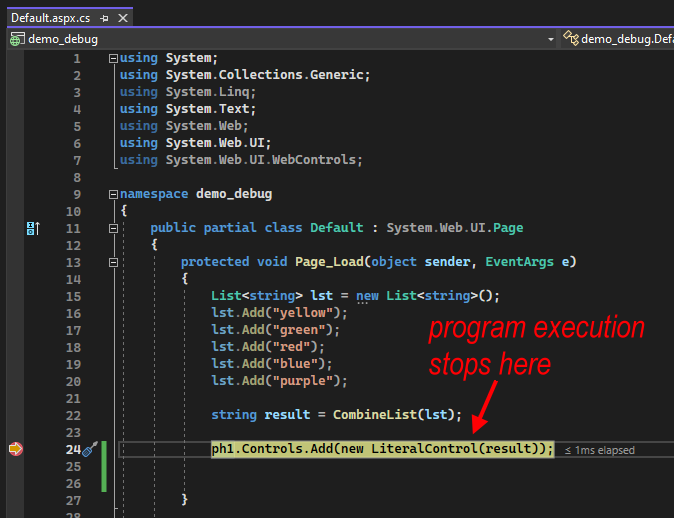
Press [F5] to Start (Run the Application)
When the compiler hits the break point, it will stop executing code there.
The following are some of the things that we can do during break point is hit in debugging mode.
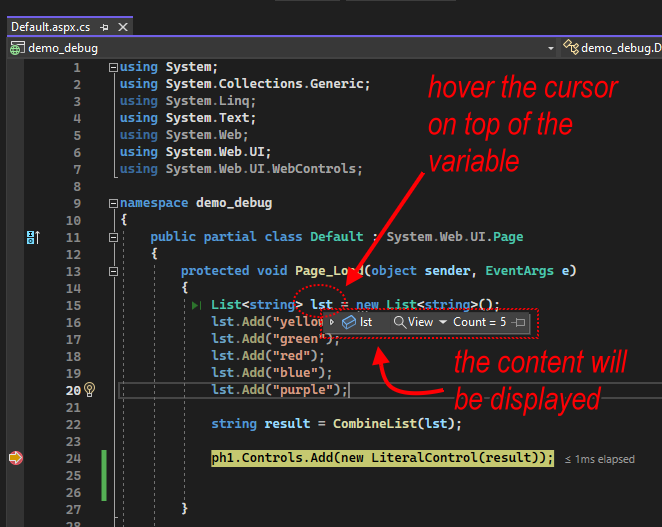
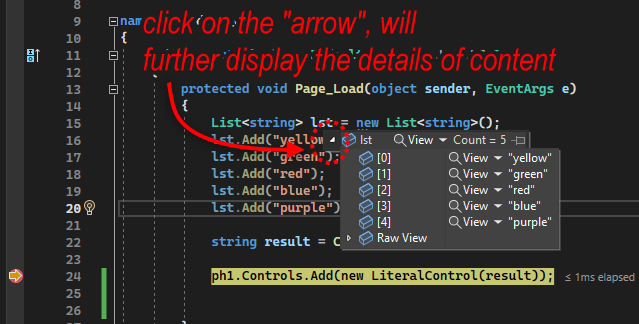
Hover the Cursor on Variables to Inspect the Values
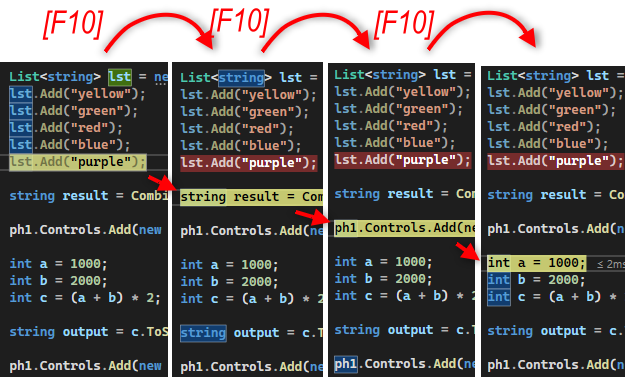
Press [F10] or [F11] to Proceed Execution One Line At a Time.
[F10] = Proceed execution of next line, but by passing methods.
[F11] = Proceed execution of next line, if hitting any methods, dive into the methods.
The line by line execution allows the identification of the exact location of an error is produced.
[F10] – Proceed execution of next line, but by passing methods.
Assuming that the break point is hit at the line lst.Add("purple");
The next line is the method CombineList(lst);
Continue pressing [F10] will skip the method, like this.
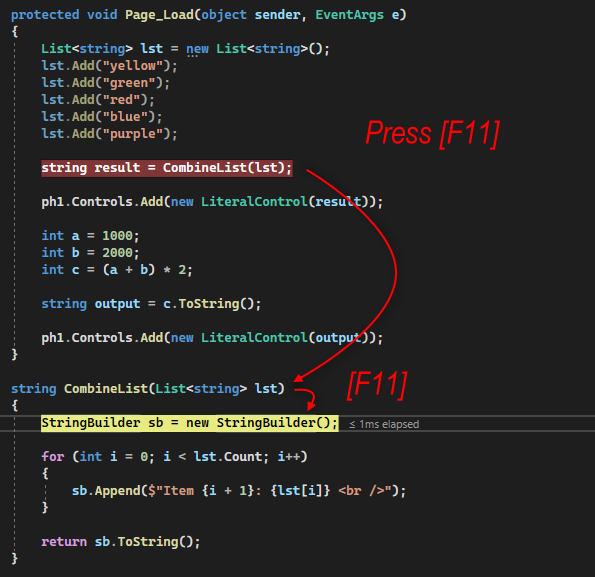
[F11] Proceed execution of next line, if hitting any methods, dive into the methods
When the compiler hits a method, it will dive into code of the method, as explained below:
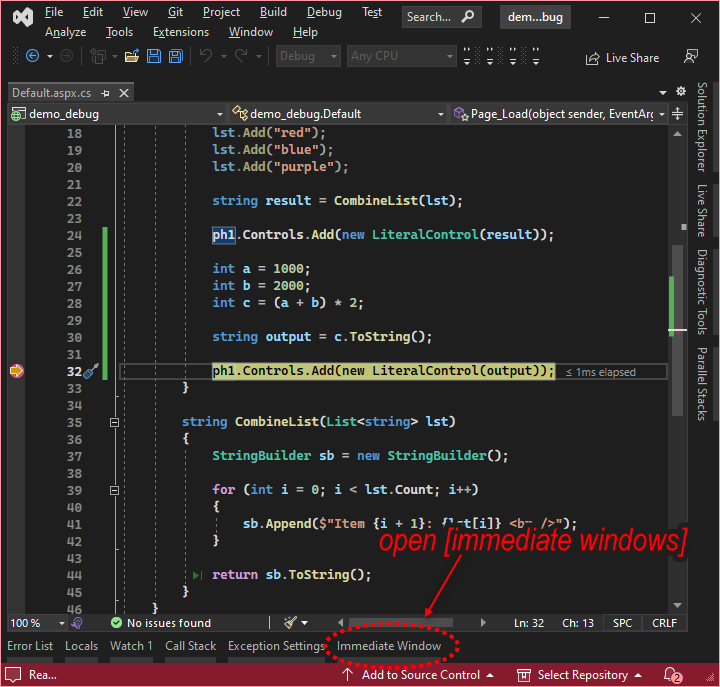
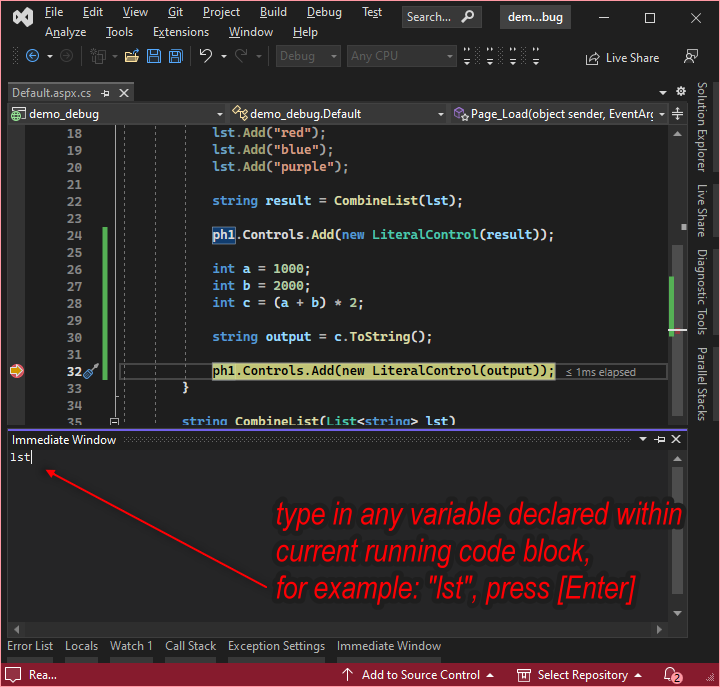
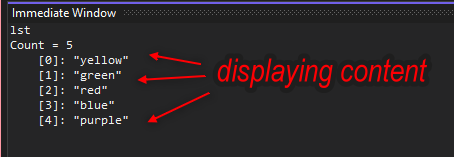
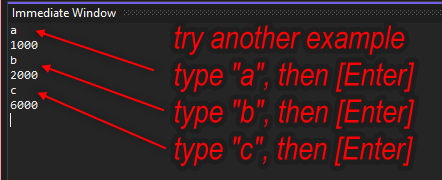
Using [Immediate Window]
[Immediate Window] is used to inspect values of variables in command line.
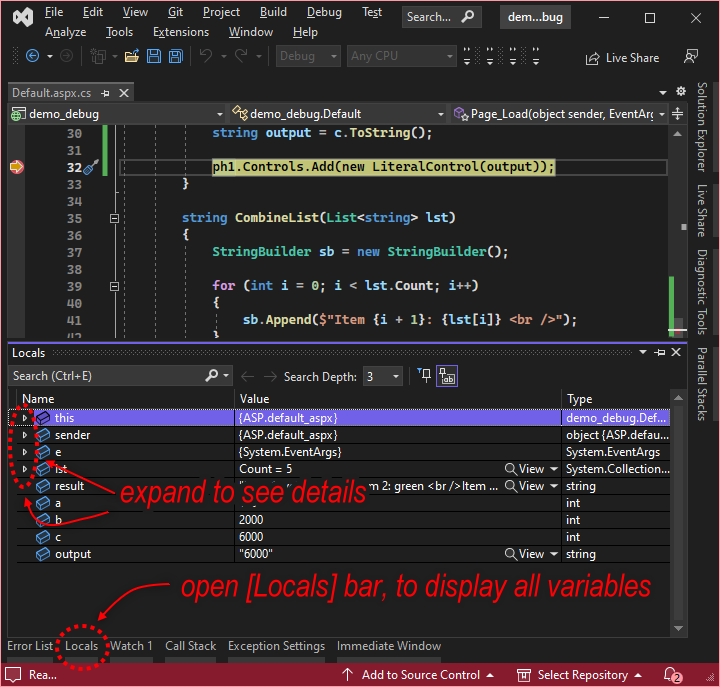
Using [Locals] bar
[Locals] is used to view all declared variables on current page.
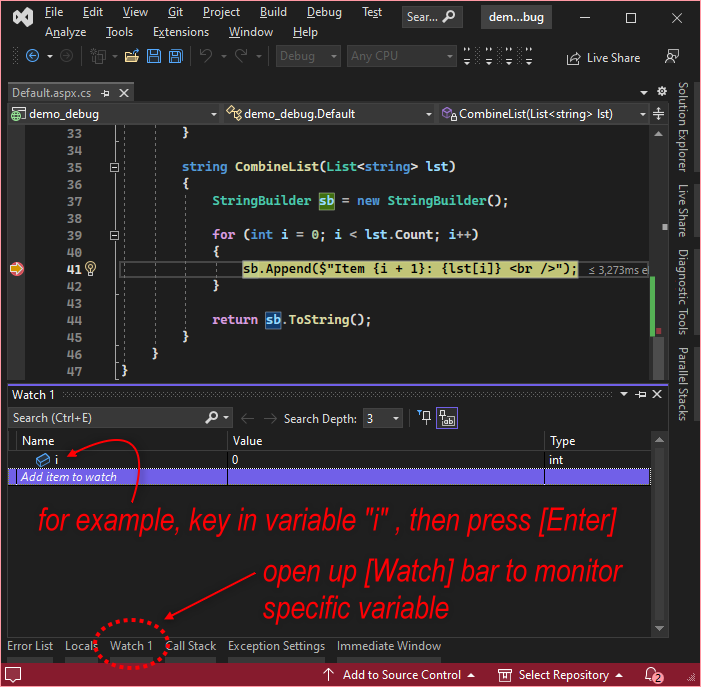
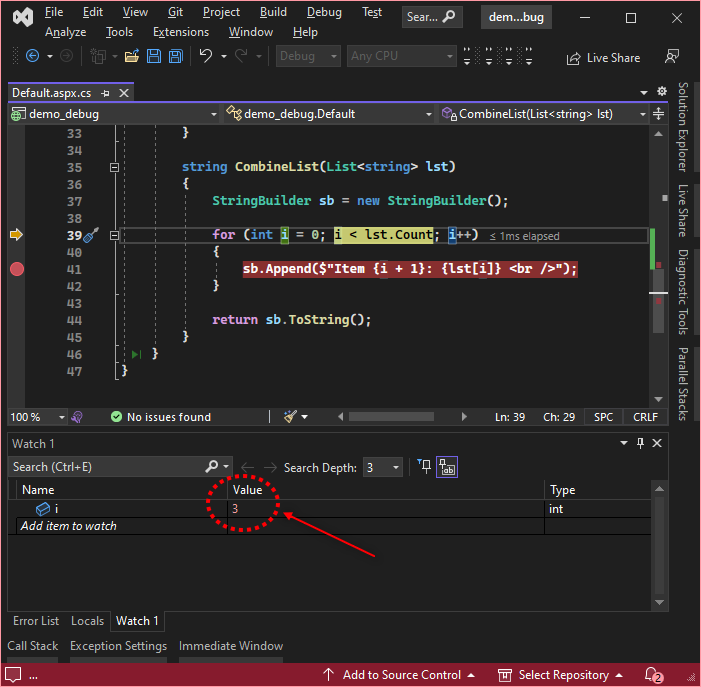
Using [Watch] bar
[Watch] bar allows inspection of specific chosen variable.
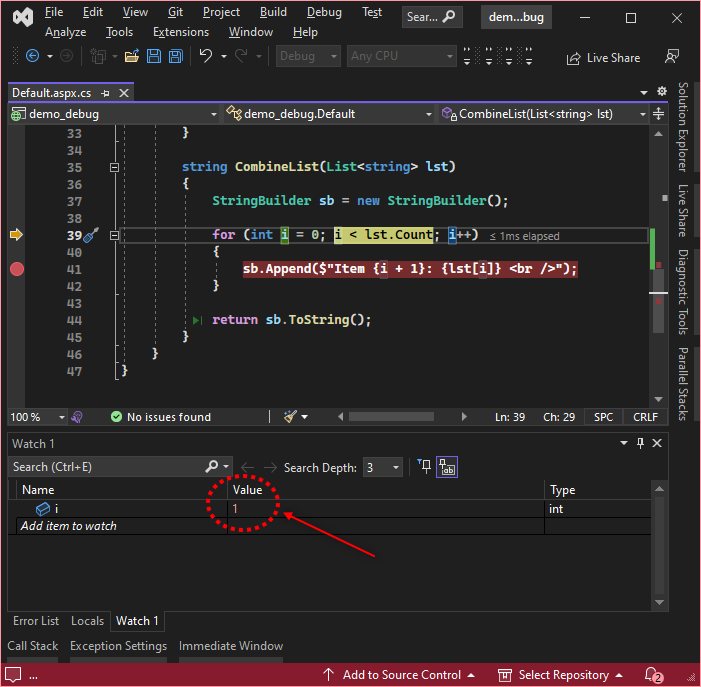
i” is changing for each loop.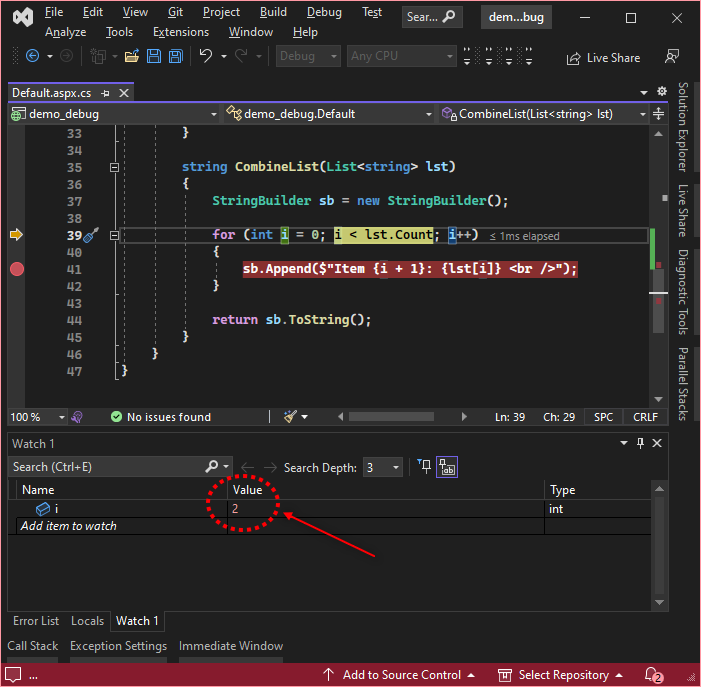
More Explanations on Youtube
Here are some of Youtube guide on debugging C# in Visual Studio
Debugging C# Code in Visual Studio (by Mosh)
https://www.youtube.com/watch?v=u-HdLtqEOog
Tips and Tricks for .NET Debugging in Visual Studio (by Microsoft)
https://www.youtube.com/watch?v=lgKInHJ-tcg
Other Error Handling Method Without Using Debugging Mode
Exception Handling | C# | Tutorial 24 (by Mike Dane)
https://www.youtube.com/watch?v=ZJRg8nrNeeA